Hi Makers,
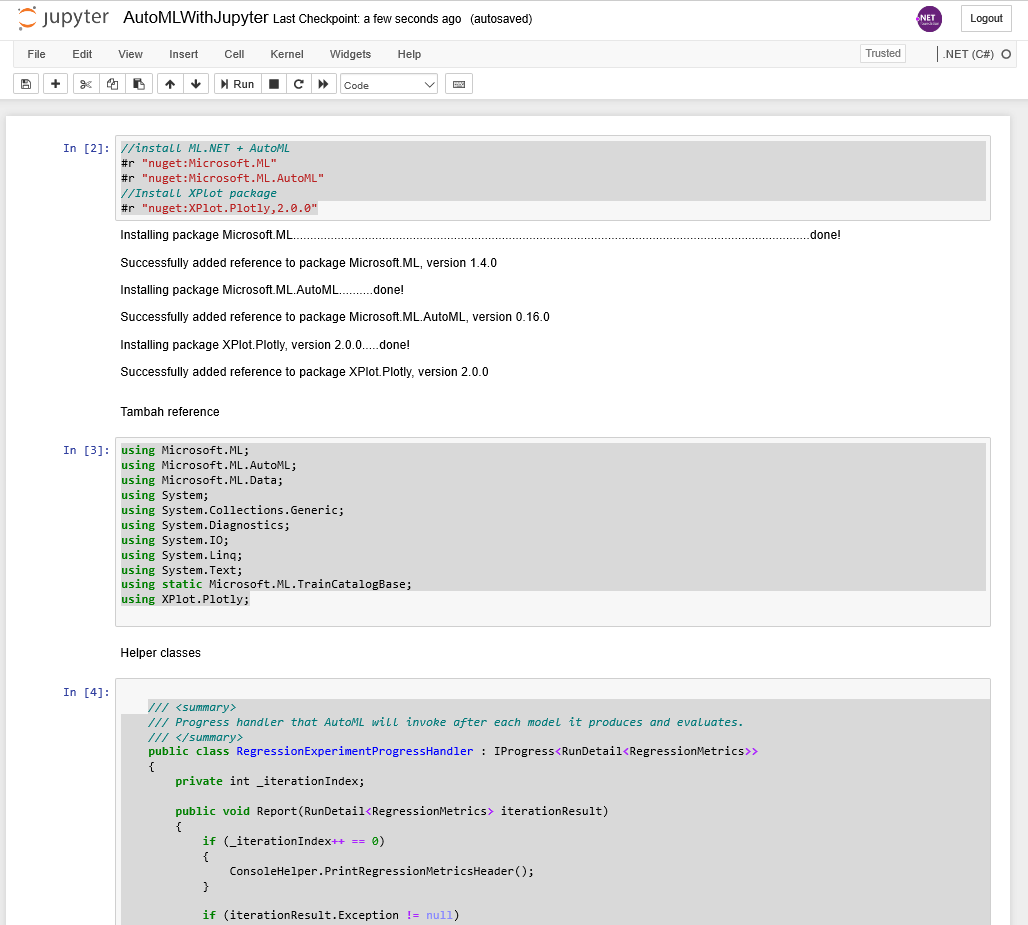
Apa kabar ? semoga sehat dan tetap produktif. Beberapa waktu lalu di acara Microsoft Ignite, di launch fitur terbaru ML.NET yaitu ML.NET di Jupyter Notebook.
Sebagai informasi jupyter notebook ini adalah aplikasi yang membantu teman-teman untuk membuat dokumen yang berisi live code, persamaan, keterangan, chart / visualisasi data yang dapat di share dan di simpan ke dalam berbagai format yang berbeda.
Dengan adanya dotnet-try, kernel .NET dapat dieksekusi di jupyter notebook ini.
Supaya ga penasaran mari kita akan coba membuat eksperimen pertama kita menggunakan jupyter notebook for ML.NET.
Instalasi
Tahapan instalasi yang dibutuhkan antara lain:
- Install dotnet core versi 3.0 ke atas
- Install dotnet-try global tool
- Install jupyter notebook (termasuk python 3)
- Aktivasi kernel .NET untuk jupyter notebook (cli command)
Oke untuk tahap pertama, rekan-rekan silakan install DotNet Core versi 3 dari link berikut: https://dotnet.microsoft.com/download
Selanjutnya install dotnet-try global tool melalui command line atau terminal dengan command berikut :
dotnet tool install -g dotnet-try
Jika sebelumnya sudah pernah install, monggo diupdate dengan command :
dotnet tool update -g dotnet-try
Untuk memastikan dotnet-try sudah terinstall silakan jalankan command berikut:
dotnet tool list -g
Selanjutnya kita perlu menginstall jupyter notebook, karena aplikasi ini membutuhkan python pastikan rekan-rekan sudah menginstall python sebelumnya, jika belum silakan install python dari link berikut:
https://www.python.org/downloads/
Sebagai informasi, saya menggunakan python versi 3.7, untuk menginstall jupyter notebook teman-teman bisa menggunakan pip, ketikan command ini pada command line atau terminal:
pip3 install –upgrade pip
pip3 install jupyter
Selanjutanya kita aktivasi .NET kernel dengan mengetikan command berikut :
dotnet try jupyter install
Nah, jupyter notebook siap digunakan. Sekarang kita akan melanjutkan eksperimen kita.
Eksperimen Dengan AutoML
Ikuti tahap-tahap berikut untuk membuat eksperimen pertama kita dengan jupyter notebook:
- Buatlah folder dengan nama “AutoMLEksperimen”
- Lalu download sample data dari link berikut : https://github.com/Gravicode/AutoMLWithJupyter/blob/master/auto-mpg.data.csv dan masukan ke dalam folder tersebut
- Kemudian buka command line / terminal, lalu masuk ke folder diatas, dan ketik : jupyter notebook
- Otomatis jendela browser akan terbuka, selanjutnya pilih menu: New > .NET (C#)
- Kita tarik beberapa nuget package: ML.NET, AutoML dan XPlot untuk charting. Isi ke dalam cell pertama kode berikut:
-
//install ML.NET + AutoML
#r "nuget:Microsoft.ML"
#r "nuget:Microsoft.ML.AutoML"
//Install XPlot package
#r "nuget:XPlot.Plotly,2.0.0" - Lalu insert cell selanjutnya, Insert > Insert Cell Below. Kita masukan beberapa referensi ke namespace yang dibutuhkan.
-
using Microsoft.ML;
using Microsoft.ML.AutoML;
using Microsoft.ML.Data;
using System;
using System.Collections.Generic;
using System.Diagnostics;
using System.IO;
using System.Linq;
using System.Text;
using static Microsoft.ML.TrainCatalogBase;
using XPlot.Plotly; - Selanjutnya kita masukan beberapa helper class, jangan lupa buat di cell baru lagi:
-
/// <summary>
    /// Progress handler that AutoML will invoke after each model it produces and evaluates.
    /// </summary>
    public class RegressionExperimentProgressHandler : IProgress<RunDetail<RegressionMetrics>>
    {
        private int _iterationIndex;

        public void Report(RunDetail<RegressionMetrics> iterationResult)
        {
            if (_iterationIndex++ == 0)
            {
                ConsoleHelper.PrintRegressionMetricsHeader();
            }

            if (iterationResult.Exception != null)
            {
                ConsoleHelper.PrintIterationException(iterationResult.Exception);
            }
            else
            {
                ConsoleHelper.PrintIterationMetrics(_iterationIndex, iterationResult.TrainerName,
                    iterationResult.ValidationMetrics, iterationResult.RuntimeInSeconds);
            }
        }
    }

    public static class ConsoleHelper
    {
        private const int Width = 114;

        public static void PrintRegressionMetrics(string name, RegressionMetrics metrics)
        {
            Console.WriteLine($"*************************************************");
            Console.WriteLine($"*       Metrics for {name} regression model      ");
            Console.WriteLine($"*------------------------------------------------");
            Console.WriteLine($"*       LossFn:        {metrics.LossFunction:0.##}");
            Console.WriteLine($"*       R2 Score:      {metrics.RSquared:0.##}");
            Console.WriteLine($"*       Absolute loss: {metrics.MeanAbsoluteError:#.##}");
            Console.WriteLine($"*       Squared loss:  {metrics.MeanSquaredError:#.##}");
            Console.WriteLine($"*       RMS loss:      {metrics.RootMeanSquaredError:#.##}");
            Console.WriteLine($"*************************************************");
        }

        public static void PrintBinaryClassificationMetrics(string name, BinaryClassificationMetrics metrics)
        {
            Console.WriteLine($"************************************************************");
            Console.WriteLine($"*       Metrics for {name} binary classification model      ");
            Console.WriteLine($"*-----------------------------------------------------------");
            Console.WriteLine($"*       Accuracy: {metrics.Accuracy:P2}");
            Console.WriteLine($"*       Area Under Curve:      {metrics.AreaUnderRocCurve:P2}");
            Console.WriteLine($"*       Area under Precision recall Curve:  {metrics.AreaUnderPrecisionRecallCurve:P2}");
            Console.WriteLine($"*       F1Score:  {metrics.F1Score:P2}");
            Console.WriteLine($"*       PositivePrecision:  {metrics.PositivePrecision:#.##}");
            Console.WriteLine($"*       PositiveRecall:  {metrics.PositiveRecall:#.##}");
            Console.WriteLine($"*       NegativePrecision:  {metrics.NegativePrecision:#.##}");
            Console.WriteLine($"*       NegativeRecall:  {metrics.NegativeRecall:P2}");
            Console.WriteLine($"************************************************************");
        }

        public static void PrintMulticlassClassificationMetrics(string name, MulticlassClassificationMetrics metrics)
        {
            Console.WriteLine($"************************************************************");
            Console.WriteLine($"*    Metrics for {name} multi-class classification model   ");
            Console.WriteLine($"*-----------------------------------------------------------");
            Console.WriteLine($"    MacroAccuracy = {metrics.MacroAccuracy:0.####}, a value between 0 and 1, the closer to 1, the better");
            Console.WriteLine($"    MicroAccuracy = {metrics.MicroAccuracy:0.####}, a value between 0 and 1, the closer to 1, the better");
            Console.WriteLine($"    LogLoss = {metrics.LogLoss:0.####}, the closer to 0, the better");
            Console.WriteLine($"    LogLoss for class 1 = {metrics.PerClassLogLoss[0]:0.####}, the closer to 0, the better");
            Console.WriteLine($"    LogLoss for class 2 = {metrics.PerClassLogLoss[1]:0.####}, the closer to 0, the better");
            Console.WriteLine($"    LogLoss for class 3 = {metrics.PerClassLogLoss[2]:0.####}, the closer to 0, the better");
            Console.WriteLine($"************************************************************");
        }

        public static void ShowDataViewInConsole(MLContext mlContext, IDataView dataView, int numberOfRows = 4)
        {
            string msg = string.Format("Show data in DataView: Showing {0} rows with the columns", numberOfRows.ToString());
            ConsoleWriteHeader(msg);

            var preViewTransformedData = dataView.Preview(maxRows: numberOfRows);

            foreach (var row in preViewTransformedData.RowView)
            {
                var ColumnCollection = row.Values;
                string lineToPrint = "Row--> ";
                foreach (KeyValuePair<string, object> column in ColumnCollection)
                {
                    lineToPrint += $"| {column.Key}:{column.Value}";
                }
                Console.WriteLine(lineToPrint + "\n");
            }
        }

        internal static void PrintIterationMetrics(int iteration, string trainerName, BinaryClassificationMetrics metrics, double? runtimeInSeconds)
        {
            CreateRow($"{iteration,-4} {trainerName,-35} {metrics?.Accuracy ?? double.NaN,9:F4} {metrics?.AreaUnderRocCurve ?? double.NaN,8:F4} {metrics?.AreaUnderPrecisionRecallCurve ?? double.NaN,8:F4} {metrics?.F1Score ?? double.NaN,9:F4} {runtimeInSeconds.Value,9:F1}", Width);
        }

        internal static void PrintIterationMetrics(int iteration, string trainerName, MulticlassClassificationMetrics metrics, double? runtimeInSeconds)
        {
            CreateRow($"{iteration,-4} {trainerName,-35} {metrics?.MicroAccuracy ?? double.NaN,14:F4} {metrics?.MacroAccuracy ?? double.NaN,14:F4} {runtimeInSeconds.Value,9:F1}", Width);
        }

        internal static void PrintIterationMetrics(int iteration, string trainerName, RegressionMetrics metrics, double? runtimeInSeconds)
        {
            CreateRow($"{iteration,-4} {trainerName,-35} {metrics?.RSquared ?? double.NaN,8:F4} {metrics?.MeanAbsoluteError ?? double.NaN,13:F2} {metrics?.MeanSquaredError ?? double.NaN,12:F2} {metrics?.RootMeanSquaredError ?? double.NaN,8:F2} {runtimeInSeconds.Value,9:F1}", Width);
        }

        internal static void PrintIterationException(Exception ex)
        {
            Console.WriteLine($"Exception during AutoML iteration: {ex}");
        }

        internal static void PrintBinaryClassificationMetricsHeader()
        {
            CreateRow($"{"",-4} {"Trainer",-35} {"Accuracy",9} {"AUC",8} {"AUPRC",8} {"F1-score",9} {"Duration",9}", Width);
        }

        internal static void PrintMulticlassClassificationMetricsHeader()
        {
            CreateRow($"{"",-4} {"Trainer",-35} {"MicroAccuracy",14} {"MacroAccuracy",14} {"Duration",9}", Width);
        }

        internal static void PrintRegressionMetricsHeader()
        {
            CreateRow($"{"",-4} {"Trainer",-35} {"RSquared",8} {"Absolute-loss",13} {"Squared-loss",12} {"RMS-loss",8} {"Duration",9}", Width);
        }

        private static void CreateRow(string message, int width)
        {
            Console.WriteLine("|" + message.PadRight(width - 2) + "|");
        }

        public static void ConsoleWriteHeader(params string[] lines)
        {
            var defaultColor = Console.ForegroundColor;
            Console.ForegroundColor = ConsoleColor.Yellow;
            Console.WriteLine(" ");
            foreach (var line in lines)
            {
                Console.WriteLine(line);
            }
            var maxLength = lines.Select(x => x.Length).Max();
            Console.WriteLine(new string('#', maxLength));
            Console.ForegroundColor = defaultColor;
        }

        public static void Print(ColumnInferenceResults results)
        {
            Console.WriteLine("Inferred dataset columns --");
            new ColumnInferencePrinter(results).Print();
            Console.WriteLine();
        }

        public static string BuildStringTable(IList<string[]> arrValues)
        {
            int[] maxColumnsWidth = GetMaxColumnsWidth(arrValues);
            var headerSpliter = new string('-', maxColumnsWidth.Sum(i => i + 3) - 1);

            var sb = new StringBuilder();
            for (int rowIndex = 0; rowIndex < arrValues.Count; rowIndex++)
            {
                if (rowIndex == 0)
                {
                    sb.AppendFormat("  {0} ", headerSpliter);
                    sb.AppendLine();
                }

                for (int colIndex = 0; colIndex < arrValues[0].Length; colIndex++)
                {
                    // Print cell
                    string cell = arrValues[rowIndex][colIndex];
                    cell = cell.PadRight(maxColumnsWidth[colIndex]);
                    sb.Append(" | ");
                    sb.Append(cell);
                }

                // Print end of line
                sb.Append(" | ");
                sb.AppendLine();

                // Print splitter
                if (rowIndex == 0)
                {
                    sb.AppendFormat(" |{0}| ", headerSpliter);
                    sb.AppendLine();
                }

                if (rowIndex == arrValues.Count - 1)
                {
                    sb.AppendFormat("  {0} ", headerSpliter);
                }
            }

            return sb.ToString();
        }

        private static int[] GetMaxColumnsWidth(IList<string[]> arrValues)
        {
            var maxColumnsWidth = new int[arrValues[0].Length];
            for (int colIndex = 0; colIndex < arrValues[0].Length; colIndex++)
            {
                for (int rowIndex = 0; rowIndex < arrValues.Count; rowIndex++)
                {
                    int newLength = arrValues[rowIndex][colIndex].Length;
                    int oldLength = maxColumnsWidth[colIndex];

                    if (newLength > oldLength)
                    {
                        maxColumnsWidth[colIndex] = newLength;
                    }
                }
            }

            return maxColumnsWidth;
        }

        class ColumnInferencePrinter
        {
            private static readonly string[] TableHeaders = new[] { "Name", "Data Type", "Purpose" };

            private readonly ColumnInferenceResults _results;

            public ColumnInferencePrinter(ColumnInferenceResults results)
            {
                _results = results;
            }

            public void Print()
            {
                var tableRows = new List<string[]>();

                // Add headers
                tableRows.Add(TableHeaders);

                // Add column data
                var info = _results.ColumnInformation;
                AppendTableRow(tableRows, info.LabelColumnName, "Label");
                AppendTableRow(tableRows, info.ExampleWeightColumnName, "Weight");
                AppendTableRow(tableRows, info.SamplingKeyColumnName, "Sampling Key");
                AppendTableRows(tableRows, info.CategoricalColumnNames, "Categorical");
                AppendTableRows(tableRows, info.NumericColumnNames, "Numeric");
                AppendTableRows(tableRows, info.TextColumnNames, "Text");
                AppendTableRows(tableRows, info.IgnoredColumnNames, "Ignored");

                Console.WriteLine(ConsoleHelper.BuildStringTable(tableRows));
            }

            private void AppendTableRow(ICollection<string[]> tableRows,
                string columnName, string columnPurpose)
            {
                if (columnName == null)
                {
                    return;
                }

                tableRows.Add(new[]
                {
                columnName,
                GetColumnDataType(columnName),
                columnPurpose
            });
            }

            private void AppendTableRows(ICollection<string[]> tableRows,
                IEnumerable<string> columnNames, string columnPurpose)
            {
                foreach (var columnName in columnNames)
                {
                    AppendTableRow(tableRows, columnName, columnPurpose);
                }
            }

            private string GetColumnDataType(string columnName)
            {
                return _results.TextLoaderOptions.Columns.First(c => c.Name == columnName).DataKind.ToString();
            }
        }
} - Lalu kita masukan model untuk data input kita, di cell baru:
-
 public class ModelInput
    {
        [ColumnName("mpg"), LoadColumn(0)]
        public float Mpg { get; set; }


        [ColumnName("cylinders"), LoadColumn(1)]
        public float Cylinders { get; set; }


        [ColumnName("displacement"), LoadColumn(2)]
        public float Displacement { get; set; }


        [ColumnName("horsepower"), LoadColumn(3)]
        public float Horsepower { get; set; }


        [ColumnName("weight"), LoadColumn(4)]
        public float Weight { get; set; }


        [ColumnName("acceleration"), LoadColumn(5)]
        public float Acceleration { get; set; }


        [ColumnName("model_year"), LoadColumn(6)]
        public float Model_year { get; set; }


        [ColumnName("origin"), LoadColumn(7)]
        public float Origin { get; set; }


        [ColumnName("car_name"), LoadColumn(8)]
        public string Car_name { get; set; }


} - Lalu beberapa method utama untuk melakukan AutoML, Save Model dan beberapa fungsi cetak hasil metrik regresi
-
private static string TRAIN_DATA_FILEPATH = @"auto-mpg.data.csv";
        private static string MODEL_FILEPATH = @"MLModel.zip";

        // Create MLContext to be shared across the model creation workflow objects
        // Set a random seed for repeatable/deterministic results across multiple trainings.
        private static MLContext mlContext = new MLContext(seed: 1);

        public static void DoAutoML(uint ExpTime = 10)
        {

            Console.WriteLine($"AutoML is starting.. wait for {ExpTime} seconds");
            // Load Data
            IDataView trainingDataView = mlContext.Data.LoadFromTextFile<ModelInput>(
                                            path: TRAIN_DATA_FILEPATH,
                                            hasHeader: true,
                                            separatorChar: ',',
                                            allowQuoting: true,
                                            allowSparse: false);
            //split data
            var split = mlContext.Data.TrainTestSplit(trainingDataView, testFraction: 0.25);
            display(h4("Schema of training DataView:"));
            display(trainingDataView.Schema);

            //ekstrak kolom dari skema
            int numberOfRows = 390;
            float[] mpgs = trainingDataView.GetColumn<float>("mpg").Take(numberOfRows).ToArray();
            float[] horsepowers = trainingDataView.GetColumn<float>("horsepower").Take(numberOfRows).ToArray();
            float[] modelyears = trainingDataView.GetColumn<float>("model_year").Take(numberOfRows).ToArray();

            //tampilkan distribusi nilai MPG (miles per gallon)
            var mpgsHistogram = Chart.Plot(new Graph.Histogram() { x = mpgs, autobinx = false, nbinsx = 20 });
            var layout = new Layout.Layout()
            {
                title ="Distribution of mpgs"};
            mpgsHistogram.WithLayout(layout);
            mpgsHistogram.WithXTitle("Mpgs ranges");
            mpgsHistogram.WithYTitle("Number of case");
            display(mpgsHistogram);

            //tampilkan sebaran nilai dari horsepower vs model year, dan tampilkan dengan warna sesuai nilai mpg
            var chart = Chart.Plot(
                new Graph.Scatter()
                {
                    x = modelyears,
                    y = horsepowers,
                    mode = "markers",
                    marker = new Graph.Marker()
                    {
                        color = mpgs,
                        colorscale = "Jet"
                    }
                }
            );

            var layout1 = new Layout.Layout(){title="Plot Model Year vs. Horse Power & color scale on Mpgs"};
            chart.WithLayout(layout1);
            chart.Width = 500;
            chart.Height = 500;
            chart.WithXTitle("Model Year");
            chart.WithYTitle("Horse Power");
            chart.WithLegend(false);

            display(chart);

            //lakukan autoML untuk task regresi
            var experimentSettings = new RegressionExperimentSettings();
            experimentSettings.MaxExperimentTimeInSeconds = ExpTime;

            var experiment = mlContext.Auto().CreateRegressionExperiment(experimentSettings);

            var dataProcessPipeline = mlContext.Transforms.Concatenate("Features", new[] { "cylinders", "displacement", "horsepower", "weight", "acceleration", "model_year", "origin" });

            RegressionExperimentProgressHandler progress = new RegressionExperimentProgressHandler();

            ExperimentResult<Microsoft.ML.Data.RegressionMetrics> experimentResult = experiment.Execute(trainingDataView, labelColumnName: "mpg", preFeaturizer: dataProcessPipeline, progressHandler: progress);

            var metrics = experimentResult.BestRun.ValidationMetrics;

            //tampilkan metrik regresi untuk model dengan nilai akurasi terbaik
            PrintRegressionMetrics(metrics);

            // Save model
            SaveModel(mlContext, experimentResult.BestRun.Model, MODEL_FILEPATH, trainingDataView.Schema);

            //Test
            IDataView predictionsDataView = experimentResult.BestRun.Model.Transform(split.TestSet);
            var metrics1 = mlContext.Regression.Evaluate(predictionsDataView, labelColumnName: "mpg", scoreColumnName: "Score");

            display(metrics1);

            //komparasi nilai prediksi dengan nilai aktual dengan bar chart
            // Number of rows to use for Bar chart
            int totalNumberForBarChart = 20;

            float[] actualMpg = predictionsDataView.GetColumn<float>("mpg").Take(totalNumberForBarChart).ToArray();
            float[] predictionMpg = predictionsDataView.GetColumn<float>("Score").Take(totalNumberForBarChart).ToArray();
            int[] elements = Enumerable.Range(0, totalNumberForBarChart).ToArray();

            // Define group for Actual values
            var ActualValuesGroupBarGraph = new Graph.Bar()
            {
                x = elements,
                y = actualMpg,
                name = "Actual"
            };

            // Define group for Prediction values
            var PredictionValuesGroupBarGraph = new Graph.Bar()
            {
                x = elements,
                y = predictionMpg,
                name = "Predicted"
            };

            var chart2 = Chart.Plot(new[] { ActualValuesGroupBarGraph, PredictionValuesGroupBarGraph });
            var layout2 = new Layout.Layout() { barmode = "group", title = "Actual Mpg vs. Predicted Mpg Comparison" };
            chart2.WithLayout(layout2);
            chart2.WithXTitle("Cases");
            chart2.WithYTitle("Mpg");
            chart2.WithLegend(true);
            chart2.Width = 700;
            chart2.Height = 400;

            display(chart2);

            int totalNumber = 100;

            //komparasi antara regresi line yang terbaik dengan hasil prediksi
            // Display the Best Bit Regression Line

            // Define scatter plot grapgh (dots)
            var ActualVsPredictedGraph = new Graph.Scatter()
            {
                x = actualMpg,
                y = predictionMpg,
                mode = "markers",
                marker = new Graph.Marker() { color = "purple" } //"rgb(142, 124, 195)"
            };

            // Calculate Regression line
            // Get a touple with the two X and two Y values determining the regression line
            (double[] xArray, double[] yArray) = CalculateRegressionLine(actualMpg, predictionMpg, totalNumber);

            //display("Display values defining the regression line");
            //display(xArray);
            //display(yArray);

            // Define grapgh for the line
            var regressionLine = new Graph.Scatter()
            {
                x = xArray,
                y = yArray,
                mode = "lines"
            };


            // 'Perfect' line, 45 degrees (Predicted values equal to actual values)
            var maximumValue = Math.Max(actualMpg.Max(), predictionMpg.Max());

            var perfectLine = new Graph.Scatter()
            {
                x = new[] { 0, maximumValue },
                y = new[] { 0, maximumValue },
                mode = "lines",
                line = new Graph.Line() { color = "grey" }
            };
            //////

            // XPlot Charp samples: https://fslab.org/XPlot/chart/plotly-line-scatter-plots.html
            //Display the chart's figures
            var chart3 = Chart.Plot(new[] { ActualVsPredictedGraph, regressionLine, perfectLine });
            chart3.WithXTitle("Actual Values");
            chart3.WithYTitle("Predicted Values");
            chart3.WithLegend(true);
            chart3.WithLabels(new[] { "Prediction vs. Actual", "Regression Line", "Perfect Regression Line" });
            chart3.Width = 700;
            chart3.Height = 600;

            display(chart3);
        }
        // Function to calculate the regression line
        // (This function could be substituted by a pre-built Math function from a NuGet such as Math.NET)

        public static (double[], double[]) CalculateRegressionLine(float[] actualFares, float[] predictionFares, int totalNumber)
        {
            // Regression Line calculation explanation:
            // https://www.khanacademy.org/math/statistics-probability/describing-relationships-quantitative-data/more-on-regression/v/regression-line-example
            // Generic function for Y for the regression line
            // y = (m * x) + b;
            // Similar code: https://gist.github.com/tansey/1375526

            double yTotal = 0;
            double xTotal = 0;
            double xyMultiTotal = 0;
            double xSquareTotal = 0;

            for (int i = 0; i < (actualFares.Length); i++)
            {
                var x = actualFares[i];
                var y = predictionFares[i];

                xTotal += x;
                yTotal += y;

                double multi = x * y;
                xyMultiTotal += multi;

                double xSquare = x * x;
                xSquareTotal += xSquare;

                double ySquare = y * y;

                //display($\"-------------------------------------------------\");
                //display($\"Predicted : {y}\");
                //display($\"Actual:    {x}\");
                //display($\"-------------------------------------------------\");
            }

            double minY = yTotal / totalNumber;
            double minX = xTotal / totalNumber;
            double minXY = xyMultiTotal / totalNumber;
            double minXsquare = xSquareTotal / totalNumber;

            double m = ((minX * minY) - minXY) / ((minX * minX) - minXsquare);

            double b = minY - (m * minX);

            //Generic function for Y for the regression line
            // y = (m * x) + b;

            // Start x on 0
            double x1 = 0;
            //Function for Y1 in the line
            double y1 = (m * x1) + b;

            // Get the max val of X or Y for our X in the line so the line is long enough for outliers
            var maxValueForX = Math.Max(actualFares.Max(), predictionFares.Max());

            double x2 = maxValueForX;
            //Function for Y2 in the line
            double y2 = (m * x2) + b;

            // Extract/create two simple arrays for the line coordinates
            var xArray = new double[2];
            var yArray = new double[2];
            xArray[0] = x1;
            yArray[0] = y1;
            xArray[1] = x2;
            yArray[1] = y2;

            return (xArray, yArray);
        }
        public static void CreateModel()
        {
            // Load Data
            IDataView trainingDataView = mlContext.Data.LoadFromTextFile<ModelInput>(
                                            path: TRAIN_DATA_FILEPATH,
                                            hasHeader: true,
                                            separatorChar: ',',
                                            allowQuoting: true,
                                            allowSparse: false);

            // Build training pipeline
            IEstimator<ITransformer> trainingPipeline = BuildTrainingPipeline(mlContext);

            // Evaluate quality of Model
            Evaluate(mlContext, trainingDataView, trainingPipeline);

            // Train Model
            ITransformer mlModel = TrainModel(mlContext, trainingDataView, trainingPipeline);

            // Save model
            SaveModel(mlContext, mlModel, MODEL_FILEPATH, trainingDataView.Schema);
        }

        public static IEstimator<ITransformer> BuildTrainingPipeline(MLContext mlContext)
        {
            // Data process configuration with pipeline data transformations
            var dataProcessPipeline = mlContext.Transforms.Concatenate("Features", new[] { "cylinders", "displacement", "horsepower", "weight", "acceleration", "model_year", "origin" });
            // Set the training algorithm
            var trainer = mlContext.Regression.Trainers.FastTree(labelColumnName: "mpg", featureColumnName: "Features");
            var trainingPipeline = dataProcessPipeline.Append(trainer);

            return trainingPipeline;
        }

        public static ITransformer TrainModel(MLContext mlContext, IDataView trainingDataView, IEstimator<ITransformer> trainingPipeline)
        {
            Console.WriteLine("=============== Training  model ===============");

            ITransformer model = trainingPipeline.Fit(trainingDataView);

            Console.WriteLine("=============== End of training process ===============");
            return model;
        }

        private static void Evaluate(MLContext mlContext, IDataView trainingDataView, IEstimator<ITransformer> trainingPipeline)
        {
            // Cross-Validate with single dataset (since we don't have two datasets, one for training and for evaluate)
            // in order to evaluate and get the model's accuracy metrics
            Console.WriteLine("=============== Cross-validating to get model's accuracy metrics ===============");
            var crossValidationResults = mlContext.Regression.CrossValidate(trainingDataView, trainingPipeline, numberOfFolds: 5, labelColumnName: "Saving");
            PrintRegressionFoldsAverageMetrics(crossValidationResults);
        }

        private static void SaveModel(MLContext mlContext, ITransformer mlModel, string modelRelativePath, DataViewSchema modelInputSchema)
        {
            // Save/persist the trained model to a .ZIP file
            Console.WriteLine($"=============== Saving the model  ===============");
            mlContext.Model.Save(mlModel, modelInputSchema, GetAbsolutePath(modelRelativePath));
            Console.WriteLine("The model is saved to {0}", GetAbsolutePath(modelRelativePath));
        }

        public static string GetAbsolutePath(string relativePath)
        {
            //FileInfo _dataRoot = new FileInfo(this.GetType().Assembly.Location);
            string assemblyFolderPath = System.IO.Directory.GetCurrentDirectory();

            string fullPath = Path.Combine(assemblyFolderPath, relativePath);

            return fullPath;
        }

        public static void PrintRegressionMetrics(RegressionMetrics metrics)
        {
            Console.WriteLine($"*************************************************");
            Console.WriteLine($"*       Metrics for Regression model      ");
            Console.WriteLine($"*------------------------------------------------");
            Console.WriteLine($"*       LossFn:        {metrics.LossFunction:0.##}");
            Console.WriteLine($"*       R2 Score:      {metrics.RSquared:0.##}");
            Console.WriteLine($"*       Absolute loss: {metrics.MeanAbsoluteError:#.##}");
            Console.WriteLine($"*       Squared loss:  {metrics.MeanSquaredError:#.##}");
            Console.WriteLine($"*       RMS loss:      {metrics.RootMeanSquaredError:#.##}");
            Console.WriteLine($"*************************************************");
        }

        public static void PrintRegressionFoldsAverageMetrics(IEnumerable<TrainCatalogBase.CrossValidationResult<RegressionMetrics>> crossValidationResults)
        {
            var L1 = crossValidationResults.Select(r => r.Metrics.MeanAbsoluteError);
            var L2 = crossValidationResults.Select(r => r.Metrics.MeanSquaredError);
            var RMS = crossValidationResults.Select(r => r.Metrics.RootMeanSquaredError);
            var lossFunction = crossValidationResults.Select(r => r.Metrics.LossFunction);
            var R2 = crossValidationResults.Select(r => r.Metrics.RSquared);

            Console.WriteLine($"*************************************************************************************************************");
            Console.WriteLine($"*       Metrics for Regression model      ");
            Console.WriteLine($"*------------------------------------------------------------------------------------------------------------");
            Console.WriteLine($"*       Average L1 Loss:       {L1.Average():0.###} ");
            Console.WriteLine($"*       Average L2 Loss:       {L2.Average():0.###}  ");
            Console.WriteLine($"*       Average RMS:           {RMS.Average():0.###}  ");
            Console.WriteLine($"*       Average Loss Function: {lossFunction.Average():0.###}  ");
            Console.WriteLine($"*       Average R-squared:     {R2.Average():0.###}  ");
            Console.WriteLine($"*************************************************************************************************************");
} - Nah cell terakhir kita tinggal memanggil fungsi AutoML:
-
DoAutoML();
Saya akan memberikan sedikit penjelasan mengenai method AutoML diatas. Fungsi “display(trainingDataView.Schema);” menampilkan kolom dan tipe data dari data csv yang kita gunakan.

Kemudian kode ini:
//ekstrak kolom dari skema
int numberOfRows = 390;
float[] mpgs = trainingDataView.GetColumn<float>("mpg").Take(numberOfRows).ToArray();
float[] horsepowers = trainingDataView.GetColumn<float>("horsepower").Take(numberOfRows).ToArray();
float[] modelyears = trainingDataView.GetColumn<float>("model_year").Take(numberOfRows).ToArray();

//tampilkan distribusi nilai MPG (miles per gallon)
var mpgsHistogram = Chart.Plot(new Graph.Histogram() { x = mpgs, autobinx = false, nbinsx = 20 });
var layout = new Layout.Layout()
{
title ="Distribution of mpgs"};
mpgsHistogram.WithLayout(layout);
mpgsHistogram.WithXTitle("Mpgs ranges");
mpgsHistogram.WithYTitle("Number of case");
display(mpgsHistogram);
akan mengekstrak data dari kolom (mpg, model year dan horse power) pada dataset dan menampilkan distribusi dari kolom MPG dengan bar chart.

Lalu kode berikut:
//tampilkan sebaran nilai dari horsepower vs model year, dan tampilkan dengan warna sesuai nilai mpg
var chart = Chart.Plot(
new Graph.Scatter()
{
x = modelyears,
y = horsepowers,
mode = "markers",
marker = new Graph.Marker()
{
color = mpgs,
colorscale = "Jet"
}
}
);
var layout1 = new Layout.Layout(){title="Plot Model Year vs. Horse Power & color scale on Mpgs"};
chart.WithLayout(layout1);
chart.Width = 500;
chart.Height = 500;
chart.WithXTitle("Model Year");
chart.WithYTitle("Horse Power");
chart.WithLegend(false);

display(chart);
akan menampilkan korelasi kolom model year, horse power dan nilai mpg dengan scatter chart:

Lalu pada kode berikut:
//lakukan autoML untuk task regresi
var experimentSettings = new RegressionExperimentSettings();
experimentSettings.MaxExperimentTimeInSeconds = ExpTime;

var experiment = mlContext.Auto().CreateRegressionExperiment(experimentSettings);

var dataProcessPipeline = mlContext.Transforms.Concatenate("Features", new[] { "cylinders", "displacement", "horsepower", "weight", "acceleration", "model_year", "origin" });

RegressionExperimentProgressHandler progress = new RegressionExperimentProgressHandler();

ExperimentResult<Microsoft.ML.Data.RegressionMetrics> experimentResult = experiment.Execute(trainingDataView, labelColumnName: "mpg", preFeaturizer: dataProcessPipeline, progressHandler: progress);

var metrics = experimentResult.BestRun.ValidationMetrics;

//tampilkan metrik regresi untuk model dengan nilai akurasi terbaik
PrintRegressionMetrics(metrics);

// Save model
SaveModel(mlContext, experimentResult.BestRun.Model, MODEL_FILEPATH, trainingDataView.Schema);
//Test
IDataView predictionsDataView = experimentResult.BestRun.Model.Transform(split.TestSet);
var metrics1 = mlContext.Regression.Evaluate(predictionsDataView, labelColumnName: "mpg", scoreColumnName: "Score");

display(metrics1);
akan menjalankan eksperimen automl dengan parameter durasi, lalu menampilkan metrik model dengan akurasi terbaik dan menyimpan model ke dalam file (zip).

Selanjutnya kode berikut:
//komparasi nilai prediksi dengan nilai aktual dengan bar chart
// Number of rows to use for Bar chart
int totalNumberForBarChart = 20;

float[] actualMpg = predictionsDataView.GetColumn<float>("mpg").Take(totalNumberForBarChart).ToArray();
float[] predictionMpg = predictionsDataView.GetColumn<float>("Score").Take(totalNumberForBarChart).ToArray();
int[] elements = Enumerable.Range(0, totalNumberForBarChart).ToArray();

// Define group for Actual values
var ActualValuesGroupBarGraph = new Graph.Bar()
{
x = elements,
y = actualMpg,
name = "Actual"
};

// Define group for Prediction values
var PredictionValuesGroupBarGraph = new Graph.Bar()
{
x = elements,
y = predictionMpg,
name = "Predicted"
};

var chart2 = Chart.Plot(new[] { ActualValuesGroupBarGraph, PredictionValuesGroupBarGraph });
var layout2 = new Layout.Layout() { barmode = "group", title = "Actual Mpg vs. Predicted Mpg Comparison" };
chart2.WithLayout(layout2);
chart2.WithXTitle("Cases");
chart2.WithYTitle("Mpg");
chart2.WithLegend(true);
chart2.Width = 700;
chart2.Height = 400;

display(chart2);
Akan menampilkan komparasi hasil prediksi mpg dengan nilai aktual.

Selanjutnya kode berikut:
int totalNumber = 100;

//komparasi antara regresi line yang terbaik dengan hasil prediksi
// Display the Best Bit Regression Line

// Define scatter plot grapgh (dots)
var ActualVsPredictedGraph = new Graph.Scatter()
{
x = actualMpg,
y = predictionMpg,
mode = "markers",
marker = new Graph.Marker() { color = "purple" } //"rgb(142, 124, 195)"
};

// Calculate Regression line
// Get a touple with the two X and two Y values determining the regression line
(double[] xArray, double[] yArray) = CalculateRegressionLine(actualMpg, predictionMpg, totalNumber);

//display("Display values defining the regression line");
//display(xArray);
//display(yArray);

// Define grapgh for the line
var regressionLine = new Graph.Scatter()
{
x = xArray,
y = yArray,
mode = "lines"
};


// 'Perfect' line, 45 degrees (Predicted values equal to actual values)
var maximumValue = Math.Max(actualMpg.Max(), predictionMpg.Max());

var perfectLine = new Graph.Scatter()
{
x = new[] { 0, maximumValue },
y = new[] { 0, maximumValue },
mode = "lines",
line = new Graph.Line() { color = "grey" }
};
//////

// XPlot Charp samples: https://fslab.org/XPlot/chart/plotly-line-scatter-plots.html
//Display the chart's figures
var chart3 = Chart.Plot(new[] { ActualVsPredictedGraph, regressionLine, perfectLine });
chart3.WithXTitle("Actual Values");
chart3.WithYTitle("Predicted Values");
chart3.WithLegend(true);
chart3.WithLabels(new[] { "Prediction vs. Actual", "Regression Line", "Perfect Regression Line" });
chart3.Width = 700;
chart3.Height = 600;

display(chart3);
akan menampilkan perbedaan garis regresi sempurna (aktual) dan regresi hasil prediksi.

Simpulan
Kita dapat simpulkan bahwa jupyter notebook ini sangat cocok untuk:
- Eksplorasi data dan visualisasi data
- Membuat dokumentasi eksperimen model Machine Learning
- Membuat bahan ajar dengan Jupyter notebooks. Sangat baik karena codenya dapat langsung dapat dieksekusi
- Hands on Lab
- Untuk membuat quiz, dan exam
Contoh code yang digunakan pada artikel ini dapat diunduh pada link berikut: https://github.com/Gravicode/AutoMLWithJupyter
Selamat berkreasi, semoga dapat bermanfaat.
Salam Makers ;D
![]()


